Tableau Tutorial
To install Tableau on your computer:
- Go to this link, enter your email address, and click “Download the App.” Follow the installation process described in the wizard.
To import a file:
- Open Tableau. Under “Connect”, you will see a variety of file types that you can open in Tableau. For your purposes, you will probably want to import an Excel file or a CSV. For Excel, click “Microsoft Excel”; for a CSV, click “Text file.” Choose your file from the browser.
- Tableau will open your file in a “Data Source” tab. This may display your data in spreadsheet format, or may just show the headers. Either way, find the tab at the bottom left that says “Sheet 1” and click on it.
To create a graph:
- All of your variables will appear on the left, under “Data.” You can drag each variable to “Columns,” “Rows,” “Filters,” and “Marks.” Essentially, Columns is the Y axis, and Rows is the X axis, Filters allow you to select or remove parts of the data, and Marks allow for things like color coding.
- On the right, under “Show Me”, there is a drop-down list of different types of charts. If you hover over each one, it will tell you how many dimensions (qualitative/categorical variables) and measures (quantitative variables) you need to create that graph. For example, for a bar graph, you need at least one measure, and usually at least one dimension.
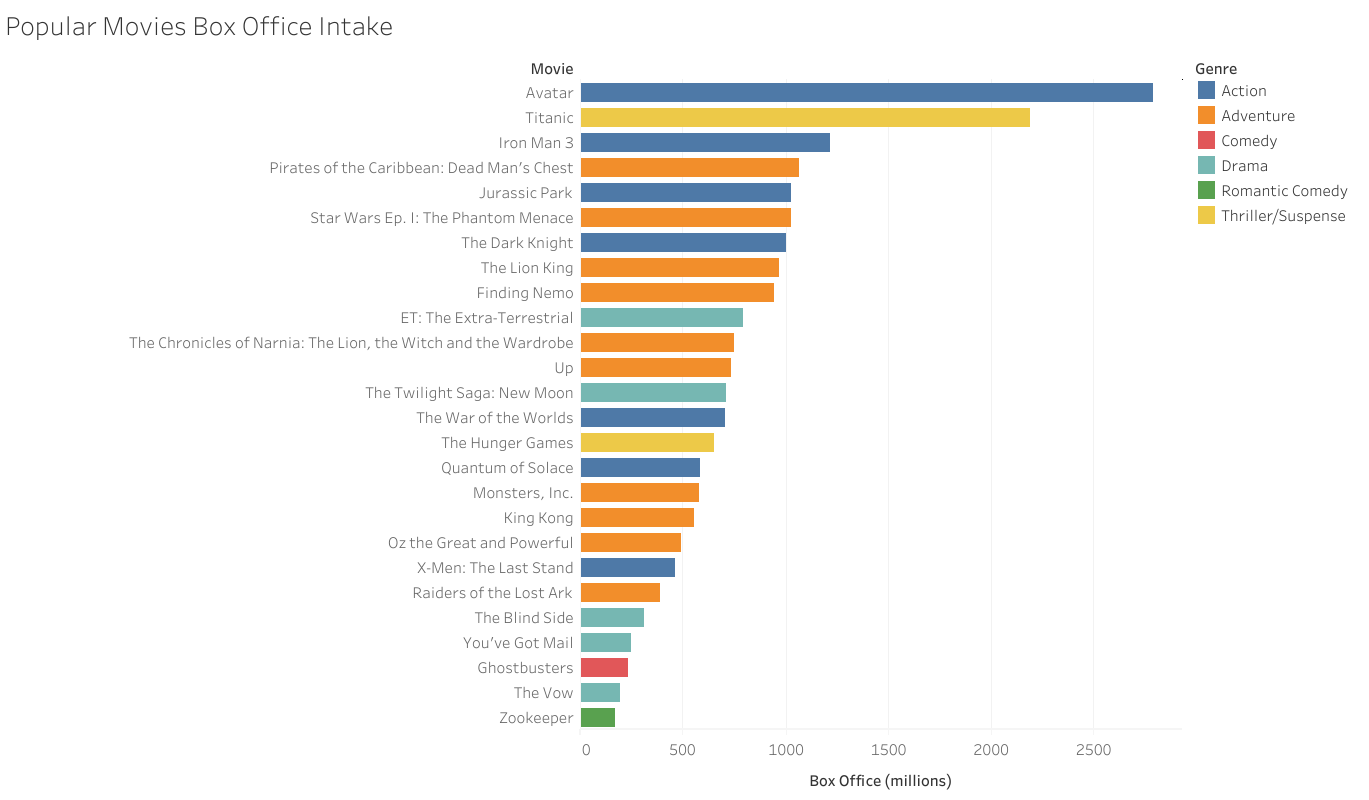
- To create a bar graph, select “Horizontal bars” under “Show me” and drag your measure to Columns and your dimension to Rows (or vice versa for a vertical bar graph). If you want to color code any of the bars, drag another dimension to “Color” under Marks. An example of this, using the movies dataset from RAWGraphs, is shown below.
To export your graph:
- To save your graph, you will need a Tableau Public account, which will save your file to the server and allow you to embed a link to the graph in a website. Go to File > Save to Tableau Public… and create a profile. If you don’t want your data to be visible to the Internet, go to Settings and check “Set my vizzes to hidden.”
- For most purposes, you will want an image of your graph, not an embeddable link. To get an image in PNG format, once you see your image online, click the X on the green banner and choose “Edit” at the top. This will allow you to edit your graph online. From the gray bar at the top, click the Download icon and choose Image. You will now have an image of your graph!
- Alternatively, if this is too much trouble, you can just screenshot your graph from the desktop app.
[button target=”_self” hover_type=”default” text=”Back to Methods and Tools Page” icon_color=”#dd3333″ link=”https://digi.uga.edu/methods/”]